
Recent Price Activity and Volatility
As of January 23, 2026, Bitcoin (BTC) is trading at approximately $88,909, reflecting a slight decline from the previous day’s close. Over the past month, Bitcoin has experienced notable volatility, with prices fluctuating between $87,341 and $97,860. This period of consolidation has left investors and analysts closely monitoring technical indicators for potential future movements.
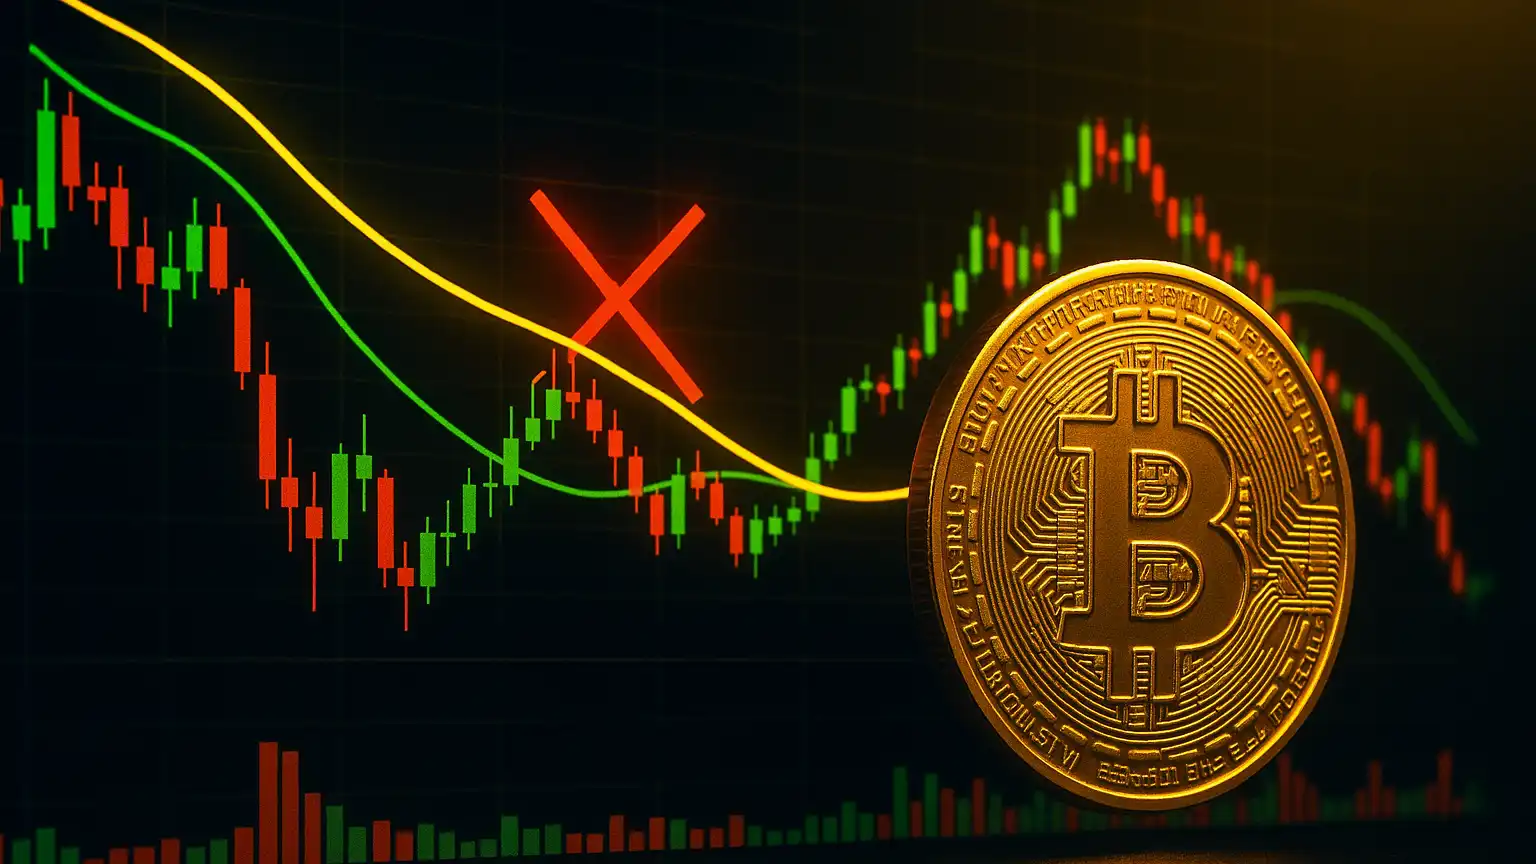
The ‘Death Cross’ Signal and Bearish Risks
A significant development in Bitcoin’s technical landscape is the emergence of a “death cross” pattern. This occurs when a short-term moving average crosses below a long-term moving average, often interpreted as a bearish signal. Historically, such patterns have preceded substantial price corrections. For instance, in September 2014, June 2018, March 2020, and January 2022, similar death crosses were followed by declines ranging from 53% to 67%. Analyst Ali Martinez suggests that, based on these historical patterns, Bitcoin could face a correction between 50% and 60%, potentially bringing prices down to the $50,000 to $38,000 range.
Further Bearish Commentary
Adding to the cautious sentiment, veteran trader Peter Brandt has projected a possible decline toward $58,000 if selling pressure continues. This perspective aligns with the concerns raised by the recent death cross, indicating that Bitcoin may be entering a period of heightened volatility and potential downside risk.
Investor Responses to Technical Signals
In response to these technical indicators, some investors are reevaluating their positions. Christopher Wood, Global Head of Equity Strategy at Jefferies, announced the removal of Bitcoin from his model investment portfolio. Citing growing concerns over advancements in quantum computing, Wood expressed fears that Bitcoin’s cryptographic security could eventually be compromised, posing a significant threat to its long-term value. Consequently, he shifted the 10% Bitcoin allocation into 5% physical gold and 5% gold mining stocks, highlighting a preference for assets with historical stability.
Bullish Scenarios: Optimistic Projections
Despite these bearish indicators, some analysts maintain a more optimistic outlook. A primary bullish scenario targets $110,000 within the next 6-8 weeks, representing a 19% advance from current levels. This projection hinges on Bitcoin breaking immediate resistance at $96,635 and sustaining momentum above the psychological $100,000 level. Technical catalysts supporting this forecast include positive MACD histogram divergence and stochastic indicators approaching oversold territory.
Bottom Line
In conclusion, Bitcoin’s current market position is characterized by a complex interplay of technical signals and investor sentiment. While historical patterns and recent technical indicators suggest potential downside risks, bullish projections highlight the possibility of upward momentum if key resistance levels are breached. Investors are advised to stay informed and consider both technical analyses and broader market developments when making investment decisions.